Introduction
The evolving tariff policies have been consistently challenging companies’ supply chain resilience
and profitability gloabally. Recent substantial tariff increases between major economies have forced
multinational firms to re-assess manufacturing footprints and investment strategies across different
regions. In this context, optimization models offer a systematic approach to evaluating cost–benefit
trade-offs and planning strategic responses over a multi-period horizon.
This report presents a Mixed Integer Linear Programming (MILP) model designed to maximize
gross profit for a representative company by optimizing production, capacity investments, and facility
locations across multiple countries over a fixed number of consecutive quarters. For tier-1 suppliers,
various cost are considered such as manufacturing cost, facility fixed cost and labor cost, as well as
tariff and quality-penalty factors. According to some preliminary study, the tariff policy change has
not yet broadly impacted the trade between non-major countries. So all the cost for tier 2 and 3
suppliers including tariffs are reflected in the prices of the goods they supply. These models[1, 2, 3, 4]
are considered as references for this report. For simplification, only the most relevant variables and
parameters are considered. Three industry cases were studied – footwear (Nike), automobile parts
(Dana Incorporated), and consumer electronics (Apple). The results illustrate that different supply
chain strategies should be adopted across different industries and under varying tariff rates. Some
interesting market projections are also conducted from an investor’s perspective.
The assumptions in this report include the following.
- For each company, only one target market and one product is considered.
- There can only be at most one facility in one country. So the country index is used to represent the corresponding facility.
- The transfer values, which are used for customs declaration, are the same as the total manufacturing cost of the products.
- For OEM products, the manufactures’ profit is included in the operation cost of manufacturing facilities.
- Increased capacity is available next quarter while newly built facility is available 4 quarters
after the decision. The initial capacity for a new built facility is 25% of its maximum capacity.
Suppose the only possible capacity increase option each quarter is by 10% of the maximum
capacity. Any capacity decision should be made at quarter start.
Model Definition
- Decision Variables
: Units of finished products produced in country at quarter .
: Binary investment decision to increase 10% maximum production capacity in country at quarter .
: Binary investment decision to build a new facility for products in country at quarter .
: Binary decision variable = 1 if there was a decision in country to increase capacity at quarter t-1, or to build a new facility at quarter .
: Binary variable. 1 if there is available facility in country i at quarter t, otherwise 0.
: The capacity at country i and quarter t.
: The operation cost for the facility in country i every quarter.
-
Parameters
- General Parameters
: number of consecutive quarters : Unite price for products at quarter .
: Demand for products at quarter .
: Maximum manufacturing capacity for the facility at country i.
: The initial capacity at country i and quarter 1.
: Quantity for material or part c to make one unit of product at country i and quarter t.
: A small positive number.
- Costs
: The cost of building a new facility at country i at quarter t.
: The cost of investing on facilities for increasing capacity to the maximum at country i at quarter t.
: The fixed operation cost for the facility in country i every quarter.
: Unit price of material or parts c at country i.
: Unit transportation cost of material or parts c at country i.
: Unit transportation cost of products from country i.
: Unit human labor cost rate at country i.
: Tariff rate imported from country i.
: Low quality rate of product at country i.
- General Parameters
-
Definitions and Expressions
-
Revenue
-
Facility Cost
- Investment cost for increasing to maximum capacity.- Investment cost for new facilities.
- Quarterly fixed operation cost of manufacturing facilities.
-
Manufacturing Cost
- Raw material cost.- Transportation cost of raw material and parts.
- Transportation cost of finished products.
- Human labor cost.
- Cost in total for manufacturing products.
- Low-quality penalty cost
-
Government related cost.
- Tariff cost.
-
-
Objective
-
Constraints
-
Demand satisfaction
-
Production capacity limits
( can never happen because of constraint v and vi.)
So the above two conditions are equal to the 6 conditions below -
if there is a facility available, it will always be available in the future.
-
no capacity means no facility available, and vice versa
-
Cannot build new facility if there is already one.
-
Cannot increase capacity if no available facility.
-
Cannot increase capacity if already at maximum.
-
No operation cost if no available facilities
-
Variables
-
Implementation
-
Data
This report gathered data for 3 companies, each of which acts as a representative for a different industry – footwear, automobile parts and consumer electronics. For manufacturing cost, it is simplified as only major materials are considered. Some data was collected from open data source [5, 6, 7, 8, 9, 10, 11, 12]. Other data was synthesized by estimation. ChatGPT[13] is used for assistance. Regarding the data from government policies, the current data is used when drafting the report (Late April, 2025) but please note that it is susceptible to change. None of the data in this report has been validated and it should be used for research purpose of optimization models only. Full data can be located in the appendix table 1, 2 and 3. -
Results analysis
-
Different strategies for different industries
For Nike, which makes the Air Max Sneakers shoes, their suppliers are changing from initially 50% in China and 50% in Vietnam (Figure 1), to mostly in Vietnam and occasionally in India. China’s manufacturing of these shoes will drop rapidly to a low level due to a 172.5% tariff rate. There is unlikely any increase in US according to this model due to high investment cost on new facilities and higher manufacturing cost than Vietnam and India. For quarters between -2 to 0, the tariff policy in 2024 is used while keeping all other data unchanged. All figures in this report are under the similar settings unless specified otherwise.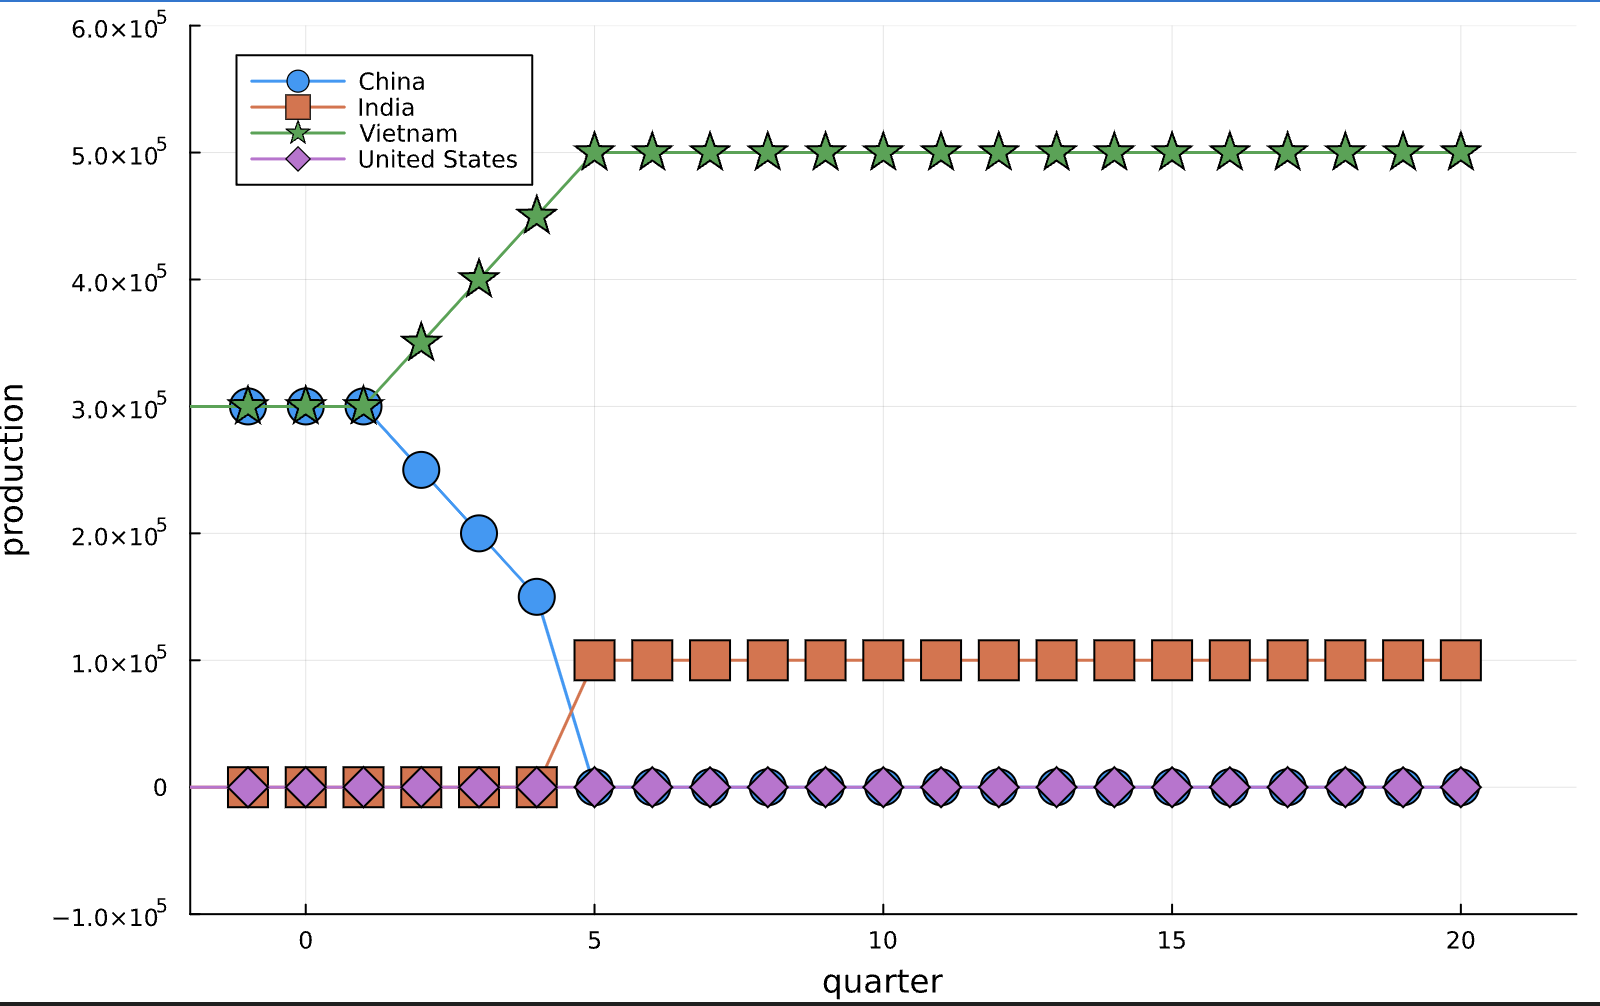
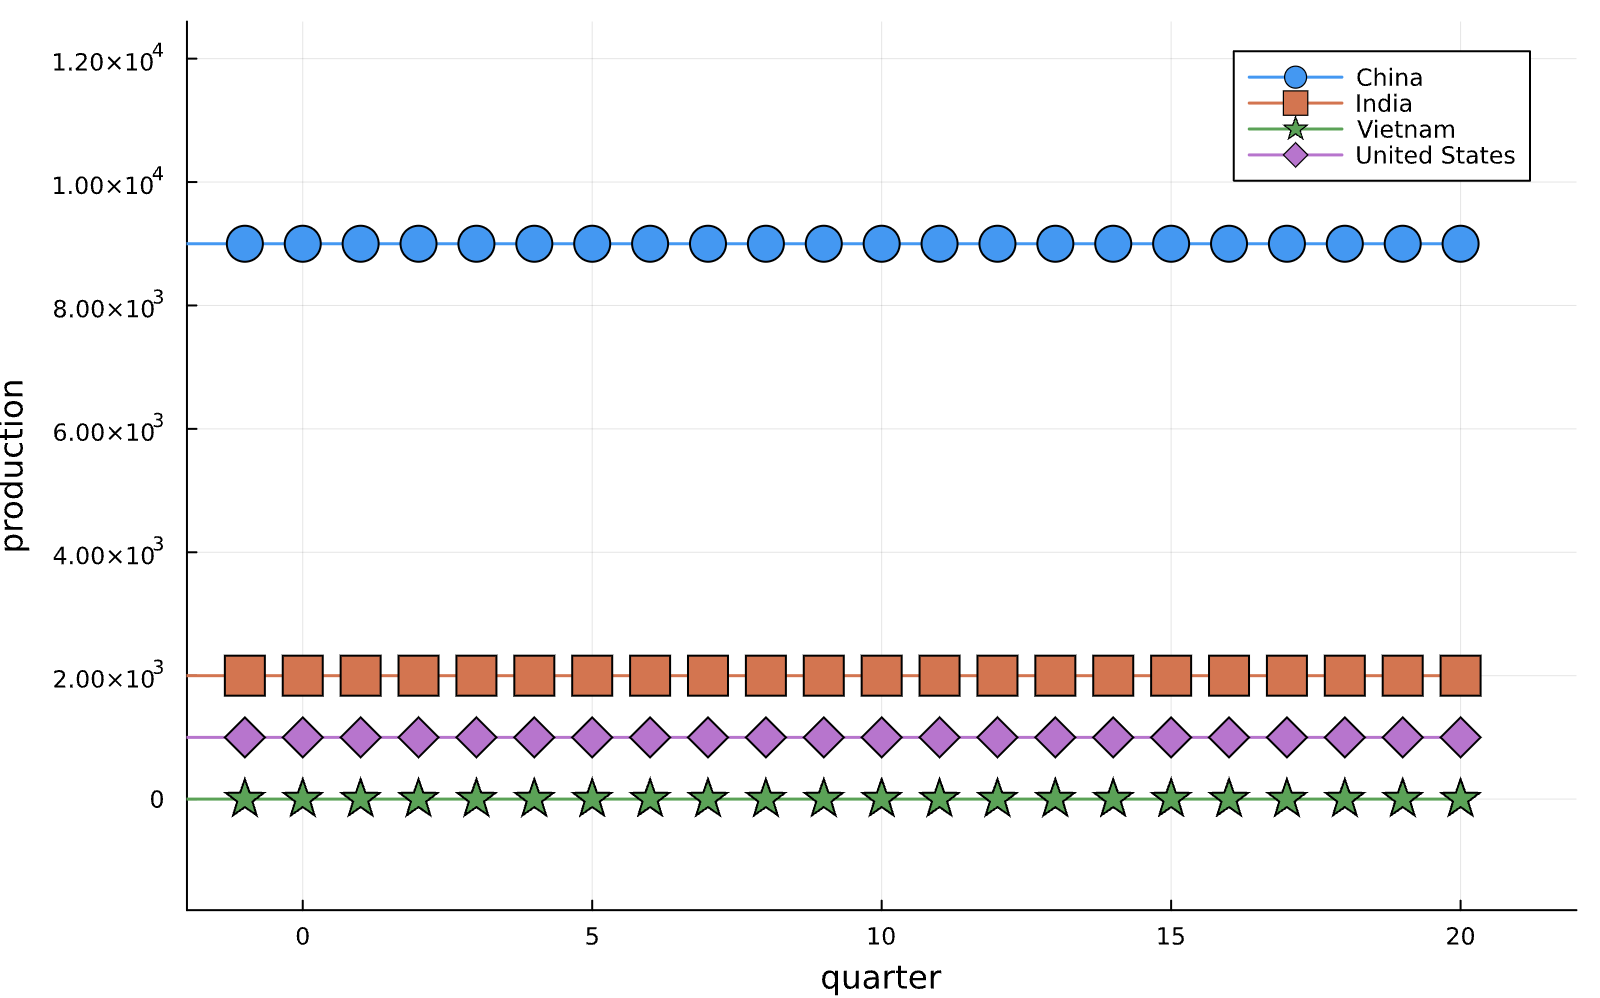
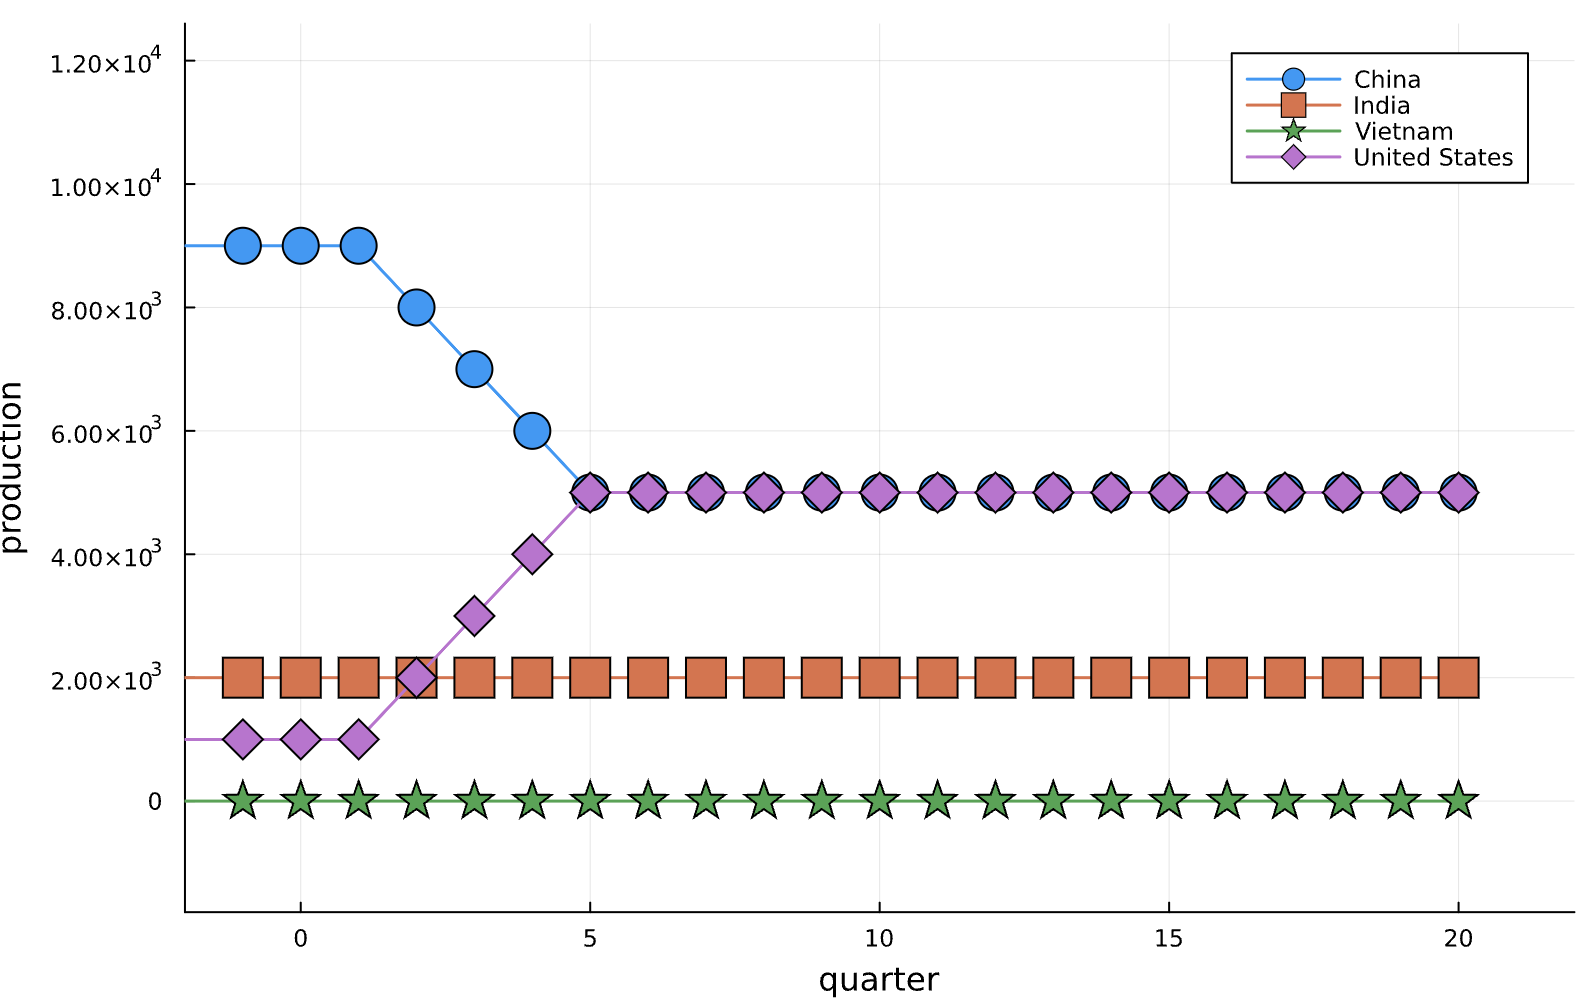
Figure 1: Nike’s supply chain optimization strategy Dana Incorporated’s factories for automobile axles are moving from China to United States and India (Figure 2) due to a tariff rate of 147%. The automobile industry in US will hopefully benefit from this migration due to its existing facilities. The capacity for domestic production will grow and eventually own a large share for the US market. India’s production will double as well. There is unlikely any large investment growth for Vietnam in this industry.
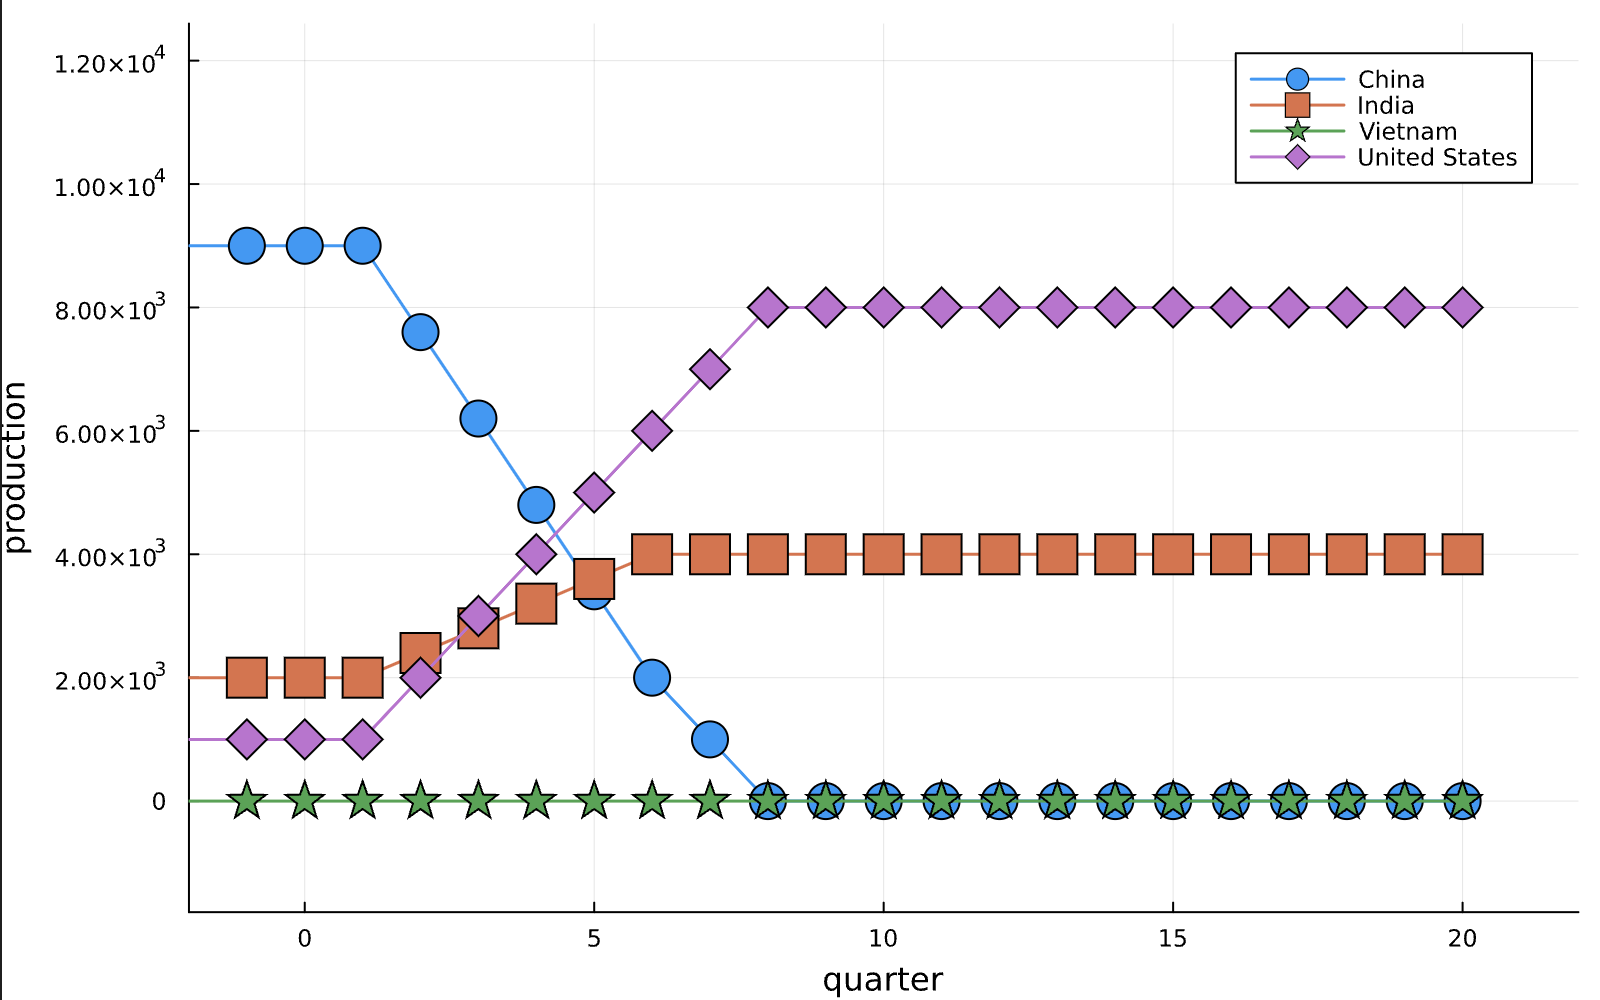
Figure 2: Dana’s supply chain optimization strategy Apple will possibly move a large portion of iPhone OEM from China to India within 10 quarters (Figure 3). India is benefiting from its existing facilities. China will continue to make a small portion of iPhones due to India’s manufacturing capacity limit. It is very expensive to build a new facility in US or Vietnam for making high-tech electronics such as iPhones. The labor cost in US is also significantly higher than other countries for this industry. So the model does not predict any production growth neither in US nor in Vietnam.
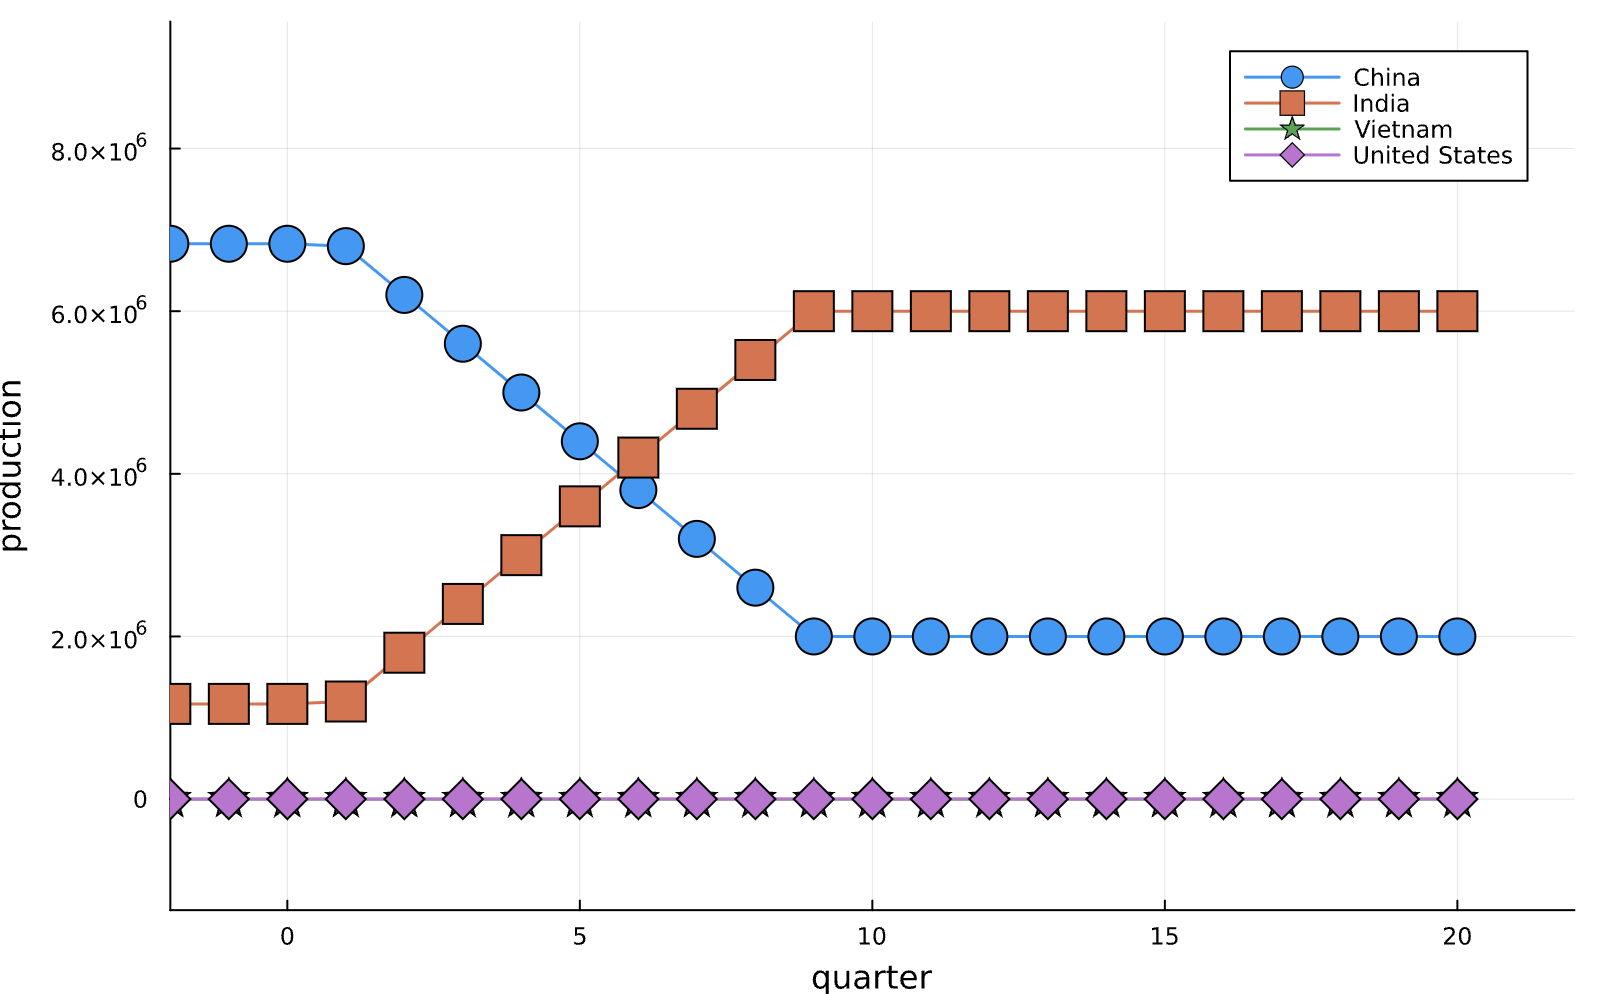
Figure 3: Apple’s supply chain optimization strategy -
Different strategies under different tariff rates
As the tariff policies between the trading countries are still subject to change, this report gives analysis of the impact to the supply chain strategies under different tariff rates. The result shows that the optimal supply chain strategy is likely to change dramatically under different tariff rates. Figure 4 is an example of such settings for Dana’s axle supply chain. Because the change on production capacity does not become effective until quarters after making the decision, it can be seen that an accurate forecasting of the tariff policy is crucial for the company to adopt the best supply chain strategy.Figure 4: Dana’s supply chain optimization strategies under different tariff rates. When the tariff rate is no greater than 47.5%, Dana’s supply chain remains what it was. When the tariff rates begins a steep climb to 75% and 147%, the best strategy for Dana is then to expand its facilities’ capacity in US and India.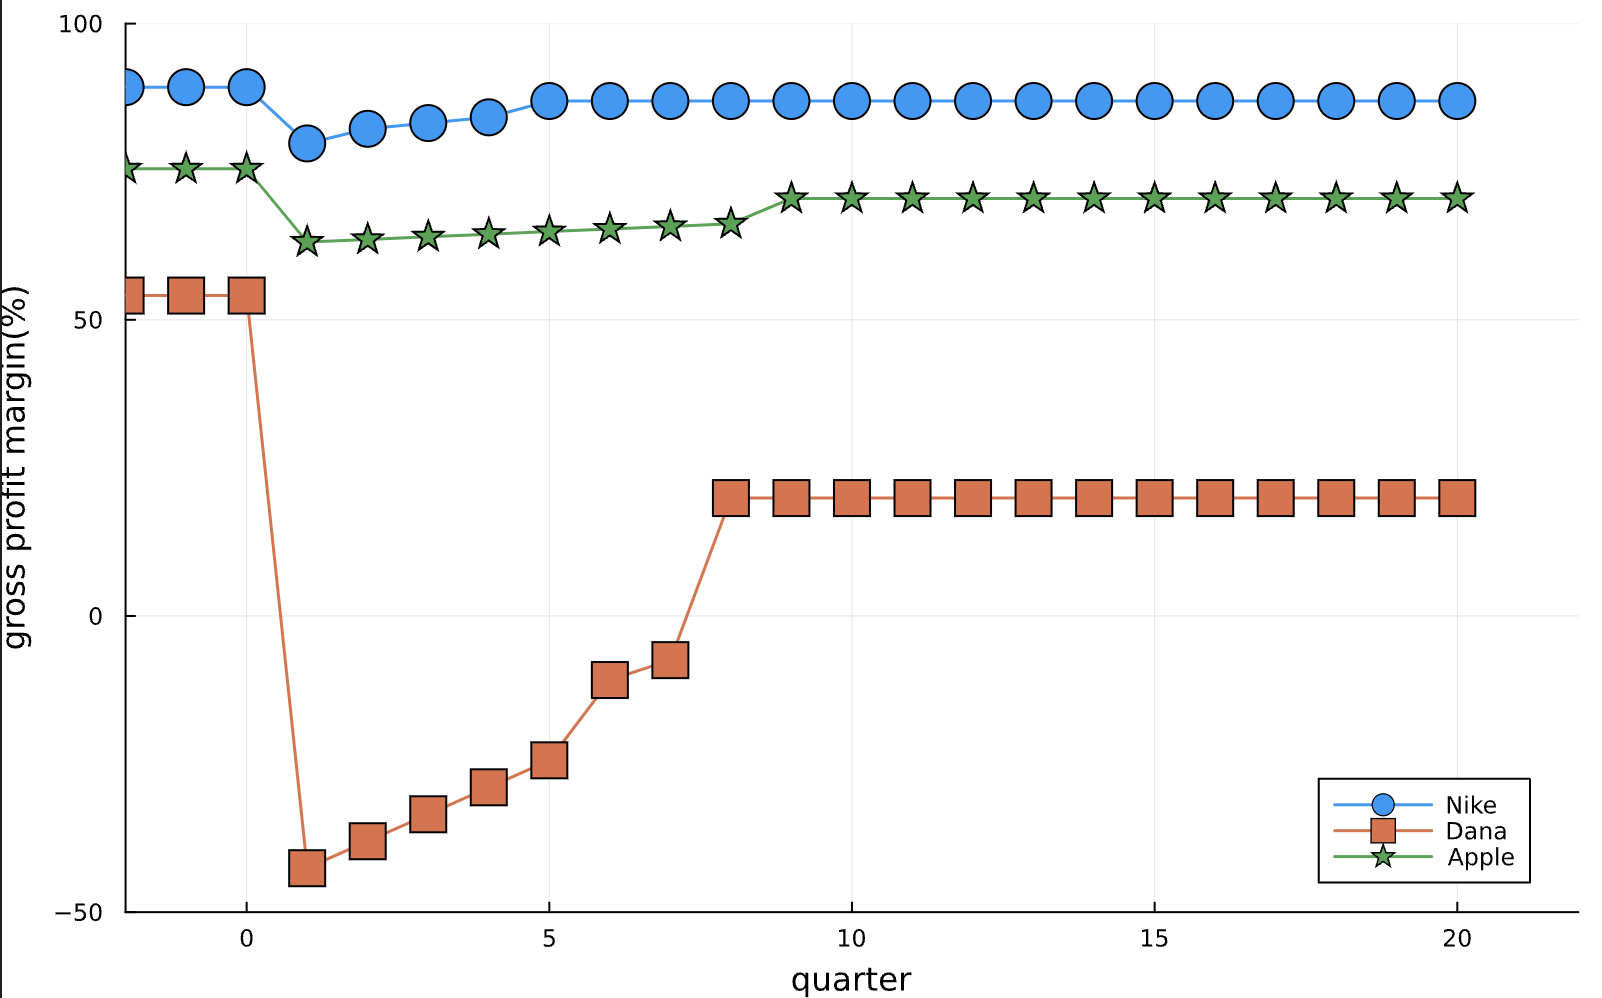
Figure 5: Quarterly Gross profit margin comparison among different industries - (Gross) Profit projection
This report tries to monitor the change on the gross profit under the optimal supply chain strategy. We can see from Figure 5 that all impacted companies have a drop for their profitability at the beginning of the new tariff era. Then after there is no more major adjustment cost ahead, the gross profit begins to recover. However, it is unlikely to ba back to the pre-tariff-era level due to some increase in manufacturing cost. Especially, the Dana company, which is in the automobile parts industry, is projected to have a large loss for the first few quarters. Apple and Nike show a more robustness to such supply chain adjustments due to their higher product profitability.
Since the focus of this report is on the supply chain, the net profit or earnings, which may be more important for the company’s market value, is not considered here. But it is not difficult to estimate if the companies would like to keep the net profit impacted at a minimum level, some company spendings will likely have to be cut off, or the companies will seek an increase for the price of their products. But neither of the two measures is actually good for the company’s future profitability. Additional government policies may be needed to compensate for the supply chain adjustment.
-
-
Conclusion
This report uses a Mixed Integer Linear Programming (MILP) model aimed at optimizing the supply chain strategies of companies in diverse industries under varying tariff rates. By considering costs such as manufacturing, transportation, tariffs, and facility investments over a 20-quarter planning horizon, the model provided detailed insights into strategic decisions that companies from different industries may undertake in the new tariff era.Also, the analysis underscored the critical role of accurate tariff forecasting, revealing how tariff rate changes significantly impact optimal supply chain decisions. Moreover, the model implied some impacts on gross profits for companies following tariff increases, with varying degrees of recovery based on individual industries’ adaptability. These results emphasize the need for companies to closely monitor and dynamically respond to tariff policies. Furthermore, the outcomes suggest that supplementary government interventions could be essential to maintain industry competitiveness and preserve long-term profitability.
References
[1] Panos Kouvelis and Meir J. Rosenblatt. A Mathematical Programming Model for Global Supply Chain Management: Conceptual Approach and Managerial Insights, pages 245–277. Springer US, Boston, MA, 2002.
[2] Asma Mecheter, Pokharel Shaligram, Tarlochan Faris, , and Fujio Tsumori. A multi-period multiple parts mixed integer linear programming model for am adoption in the spare parts supply chain. International Journal of Computer Integrated Manufacturing, 37(5):550–571, 2024. doi: 10.1080/0951192X.2023.2228263.
[3] Chang Liu, Ji Ying, Wahab M. I. M., Peng Zhisheng, Li Xinqi, , and Shaojian Qu. Multi-objective mixed integer programming modelling for closed-loop supply chain network design: an enhanced benders decomposition algorithm. Engineering Optimization, 56(12):2478–2521, 2024. doi: 10.1080/0305215X.2024.2312956.
[4] Juri Reich, Kinra Aseem, Kotzab Herbert, , and Xavier Brusset. Strategic global supply chain network design – how decision analysis combining milp and ahp on a pareto front can improve decision-making. International Journal of Production Research, 59(5):1557–1572, 2021. doi: 10.1080/00207543.2020.1847341.
[5] Nike Inc. Nike annual report 2024. https://investors.nike.com/investor-relations/financials/annual-reports/default.aspx, 2024.
[6] Dana Inc. Dana annual report 2024. https://investors.dana.com/financial-information/annual-reports, 2024.
[7] Apple Inc. Apple annual report 2024. https://investor.apple.com/investor-relations/default.aspx, 2024.
[8] The World Bank. Commodity price data (the pink sheet). https://www.worldbank.org/en/research/commodity-markets, 2024.
[9] U.S. Census Bureau. Annual survey of manufactures, 2024. https://www.census.gov/programs-surveys/asm.html, 2024.
[10] U.S. International Trade Commission. Harmonized tariff schedule of the united states. https://hts.usitc.gov/, 2024.
[11] McKinsey & Company. Global manufacturing industry report, 2023. https://www.mckinsey.com/industries/advanced-electronics/our-insights/global-manufacturing-report-2023, 2023.
[12] Deloitte. Footwear manufacturing benchmark, 2023. https://www2.deloitte.com/us/en/pages/manufacturing/articles/footwear-manufacturing-report.html, 2023.
[13] OpenAI. Chatgpt. https://chatgpt.com.
Appendix
| Parameter | China | Vietnam | India | United States |
| Maximum production capacity (unit) | 500k | 500k | 500k | 500k |
| Initial capacity (unit) | 300k | 300k | 0 | 0 |
| Material requirements per unit | ||||
| Upper material (sqm) | 0.5 | 0.5 | 0.5 | 0.5 |
| Sole material (kg) | 0.3 | 0.3 | 0.3 | 0.3 |
| Laces (unit) | 2 | 2 | 2 | 2 |
| Packaging (unit) | 1 | 1 | 1 | 1 |
| Material costs | ||||
| Upper material ($/sqm) | 10.00 | 10.50 | 11.00 | 12.00 |
| Sole material ($/kg) | 5.00 | 5.50 | 6.00 | 7.00 |
| Laces ($/unit) | 0.50 | 0.55 | 0.60 | 0.65 |
| Packaging ($/unit) | 1.00 | 1.10 | 1.20 | 1.30 |
| Material transport | ||||
| Upper material ($/sqm) | 0.10 | 0.12 | 0.15 | 0.08 |
| Sole material ($/kg) | 0.08 | 0.09 | 0.10 | 0.07 |
| Laces ($/unit) | 0.01 | 0.015 | 0.02 | 0.005 |
| Packaging ($/unit) | 0.20 | 0.22 | 0.25 | 0.18 |
| Product transport ($/unit) | 0.20 | 0.20 | 0.20 | 0.10 |
| Labor cost ($/unit) | 2.00 | 1.80 | 1.50 | 10.00 |
| Tariff rate (%) | 172.5 | 30 | 30 | 0 |
| Low-quality rate (%) | 1.5 | 1.2 | 2.0 | 0.8 |
| New facility cost (USD) | 1M | 0.8M | 0.9M | 5M |
| 10% capacity increase cost (USD) | 0.2M | 0.16M | 0.18M | 1M |
| Operation cost (USD) | 0.22M | 0.2M | 0.21M | 0.75M |
| Parameter | China | Vietnam | India | United States |
| Maximum production capacity (unit) | 10k | 10k | 10k | 10k |
| Initial capacity (unit) | 10k | 0 | 2k | 4k |
| Material requirements per unit | ||||
| Steel (kg) | 50 | 50 | 50 | 50 |
| Bearings (units) | 4 | 4 | 4 | 4 |
| Seals (units) | 2 | 2 | 2 | 2 |
| Packaging (unit) | 1 | 1 | 1 | 1 |
| Material costs | ||||
| Steel ($/kg) | 4.00 | 4.20 | 4.50 | 5.00 |
| Bearings ($/unit) | 20.00 | 22.00 | 24.00 | 25.00 |
| Seals ($/unit) | 10.00 | 11.00 | 12.00 | 13.00 |
| Packaging ($/unit) | 5.00 | 5.50 | 6.00 | 6.50 |
| Material transport | ||||
| Steel ($/kg) | 0.30 | 0.32 | 0.34 | 0.24 |
| Bearings ($/unit) | 3.75 | 4.00 | 4.25 | 3.00 |
| Seals ($/unit) | 1.50 | 1.60 | 1.70 | 1.20 |
| Packaging ($/unit) | 12.00 | 13.00 | 14.00 | 10.00 |
| Product transport ($/unit) | 25.00 | 26.00 | 27.00 | 2.00 |
| Labor cost ($/unit) | 5.00 | 4.50 | 4.00 | 25.00 |
| Tariff rate (%) | 147 | 12.5 | 12.5 | 0 |
| Low-quality rate (%) | 2.0 | 1.5 | 2.5 | 1.0 |
| New facility cost (USD) | 12M | 10M | 9M | 30M |
| 10% capacity increase cost (USD) | 1.5M | 1.3M | 1.2M | 3.6M |
| Operation cost (USD) | 1M | 0.8M | 0.9M | 3M |
| Parameter | China | Vietnam | India | United States |
| Maximum production capacity (unit) | 7M | 4M | 6M | 8M |
| Initial capacity (unit) | 7M | 0 | 1.2M | 0 |
| Material requirements per unit | ||||
| Glass (kg) | 0.050 | 0.050 | 0.050 | 0.050 |
| Aluminum (kg) | 0.030 | 0.030 | 0.030 | 0.030 |
| Battery (unit) | 1 | 1 | 1 | 1 |
| PCB assembly (unit) | 1 | 1 | 1 | 1 |
| Camera modules (units) | 2 | 2 | 2 | 2 |
| Packaging (unit) | 1 | 1 | 1 | 1 |
| Material costs | ||||
| Glass ($/kg) | 200.00 | 210.00 | 220.00 | 250.00 |
| Aluminum ($/kg) | 2.50 | 2.60 | 2.70 | 3.00 |
| Battery ($/unit) | 50.00 | 52.00 | 54.00 | 60.00 |
| PCB assembly ($/unit) | 30.00 | 31.00 | 32.00 | 35.00 |
| Camera modules ($/unit) | 40.00 | 42.00 | 44.00 | 48.00 |
| Packaging ($/unit) | 5.00 | 5.20 | 5.40 | 6.00 |
| Material transport | ||||
| Glass ($/kg) | 0.50 | 0.55 | 0.60 | 0.45 |
| Aluminum ($/kg) | 0.10 | 0.11 | 0.12 | 0.08 |
| Battery ($/unit) | 2.00 | 2.10 | 2.20 | 1.50 |
| PCB assembly ($/unit) | 1.50 | 1.60 | 1.70 | 1.20 |
| Camera modules ($/unit) | 5.00 | 5.20 | 5.40 | 4.00 |
| Packaging ($/unit) | 0.05 | 0.06 | 0.07 | 0.04 |
| Product transport ($/unit) | 1.00 | 1.00 | 1.00 | 0.05 |
| Labor cost ($/unit) | 20.00 | 18.00 | 16.00 | 100.00 |
| Tariff rate (%) | 45 | 10 | 10 | 0 |
| Low-quality rate (%) | 1.0 | 1.2 | 1.5 | 0.8 |
| New facility cost (USD) | 1.5B | 1.3B | 1.4B | 4.5B |
| 10% capacity increase cost (USD) | 300M | 260M | 280M | 900M |
| Operation cost (USD) | 120M | 50M | 80M | 250M |
Citation
If you find this analysis useful and want to cite it in your work, you can use the following BibTeX entry: